import tensorflow as tf
from tensorflow import keras
from sklearn.model_selection import train_test_split
import numpy as np
from glob import glob
from PIL import Image
import matplotlib.pyplot as plt
import os

print(tf.__version__)
print(keras.__version__)
image_datas = glob('./datas/*/*.png')
class_name = ["apple", "beef", "milk","noodle","potato"]
dic = {"apple":0, "beef":1, "milk":2, "noodle":3, "potato":4}
X = []
Y = []
for imagename in image_datas:
image = Image.open(imagename)
image = image.resize((128, 128))
image = np.array(image)
X.append(image)
label = imagename.split('/')[2]
label = dic[label]
Y.append(label)X = np.array(X)
Y = np.array(Y) train_images, test_images, train_labels, test_labels = train_test_split(X, Y, test_size=0.2,
shuffle=True, random_state=44)
train_labels = train_labels[..., tf.newaxis]
test_labels = test_labels[..., tf.newaxis]
train_images.shape, train_labels.shape, test_images.shape, test_labels.shape
## training set의 각 class 별 image 수 확인
unique, counts = np.unique(np.reshape(train_labels, (2372,)), axis=-1, return_counts=True)
dict(zip(unique, counts))
## test set의 각 class 별 image 수 확인
unique, counts = np.unique(np.reshape(test_labels, (594,)), axis=-1, return_counts=True)
dict(zip(unique, counts))
N_TRAIN = train_images.shape[0]
N_TEST = test_images.shape[0]
## Data 확인
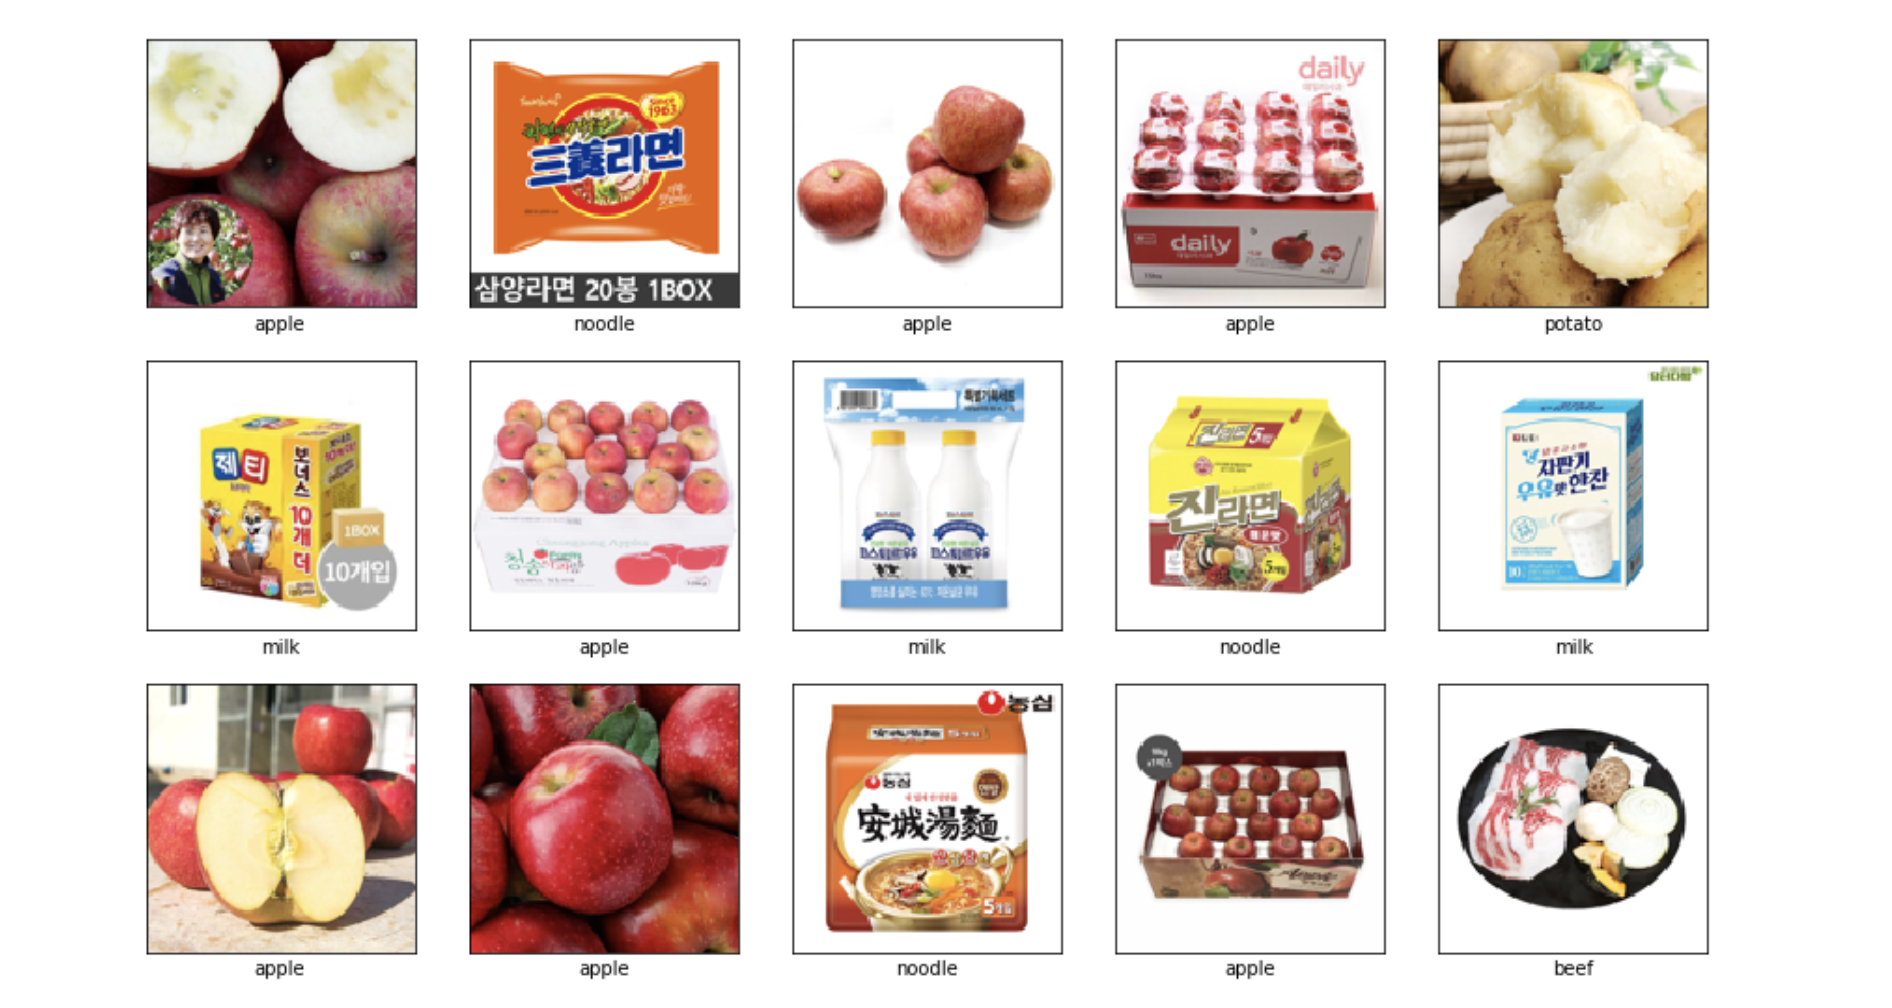
plt.figure(figsize=(15,9))
for i in range(15):
img_idx = np.random.randint(0, 2372)
plt.subplot(3,5,i+1)
plt.xticks([])
plt.yticks([])
plt.grid(False)
plt.imshow(train_images[img_idx])
plt.xlabel(class_name[train_labels[img_idx][0]])
# pixel값을 0~1사이 범위로 조정
train_images = train_images.astype(np.float32) / 255.
test_images = test_images.astype(np.float32) / 255.

# label을 onehot-encoding
train_labels = keras.utils.to_categorical(train_labels)
test_labels = keras.utils.to_categorical(test_labels)
print(train_images.shape, train_labels.shape)
print(test_images.shape, test_labels.shape)
## Hyper-parameters
learning_rate = 0.01
N_EPOCHS = 10
N_BATCH = 50
N_CLASS = 5
## dataset 구성
train_dataset = tf.data.Dataset.from_tensor_slices((train_images, train_labels)).shuffle(
buffer_size=2372).batch(N_BATCH).repeat()
test_dataset = tf.data.Dataset.from_tensor_slices((test_images, test_labels)).batch(
N_BATCH)# Sequential API를 사용하여 model 구성
def create_model():
model = keras.Sequential()
model.add(keras.layers.Conv2D(filters=32, kernel_size=3,
activation='relu', padding='SAME',
input_shape=(128, 128, 3)))
model.add(keras.layers.MaxPool2D(padding='SAME'))
model.add(keras.layers.Conv2D(filters=64, kernel_size=3,
activation='relu', padding='SAME'))
model.add(keras.layers.MaxPool2D(padding='SAME'))
model.add(keras.layers.Conv2D(filters=128, kernel_size=3,
activation='relu', padding='SAME'))
model.add(keras.layers.MaxPool2D(padding='SAME'))
model.add(keras.layers.Flatten())
model.add(keras.layers.Dense(256, activation='relu'))
model.add(keras.layers.Dropout(0.4))
model.add(keras.layers.Dense(5, activation='softmax'))
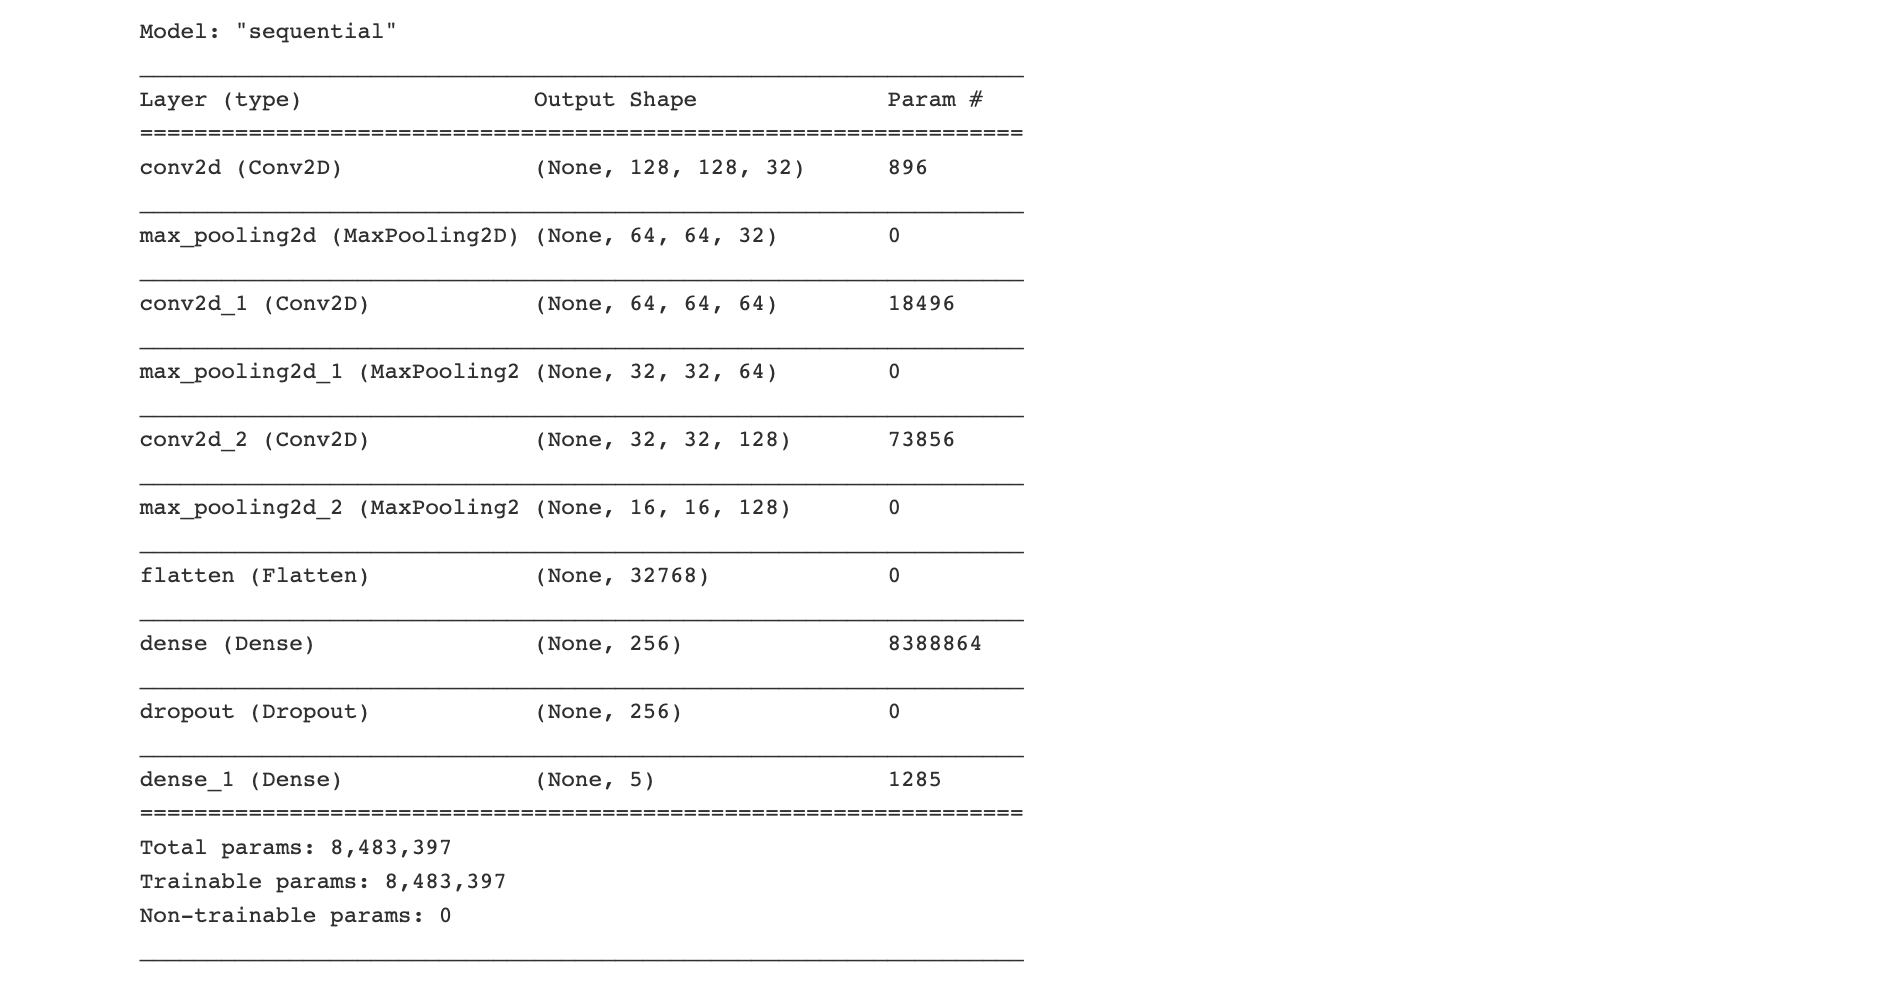
return model## Create model, compile & summary
model = create_model()
model.compile(optimizer=tf.keras.optimizers.Adam(learning_rate),
loss='categorical_crossentropy',
metrics=['accuracy'])
model.summary()
## Parameters for training
steps_per_epoch = N_TRAIN//N_BATCH
validation_steps = N_TEST//N_BATCH
print(steps_per_epoch, validation_steps)
## Training
history = model.fit(train_dataset, epochs=N_EPOCHS, steps_per_epoch=steps_per_epoch,
                    validation_data=test_dataset, validation_steps=validation_steps)
model.evaluate(test_dataset)
## Plot losses
plt.plot(history.history['loss'], 'b-', label='loss')
plt.plot(history.history['val_loss'], 'r--', label='val_loss')
plt.xlabel('Epoch')
plt.legend()
plt.show()
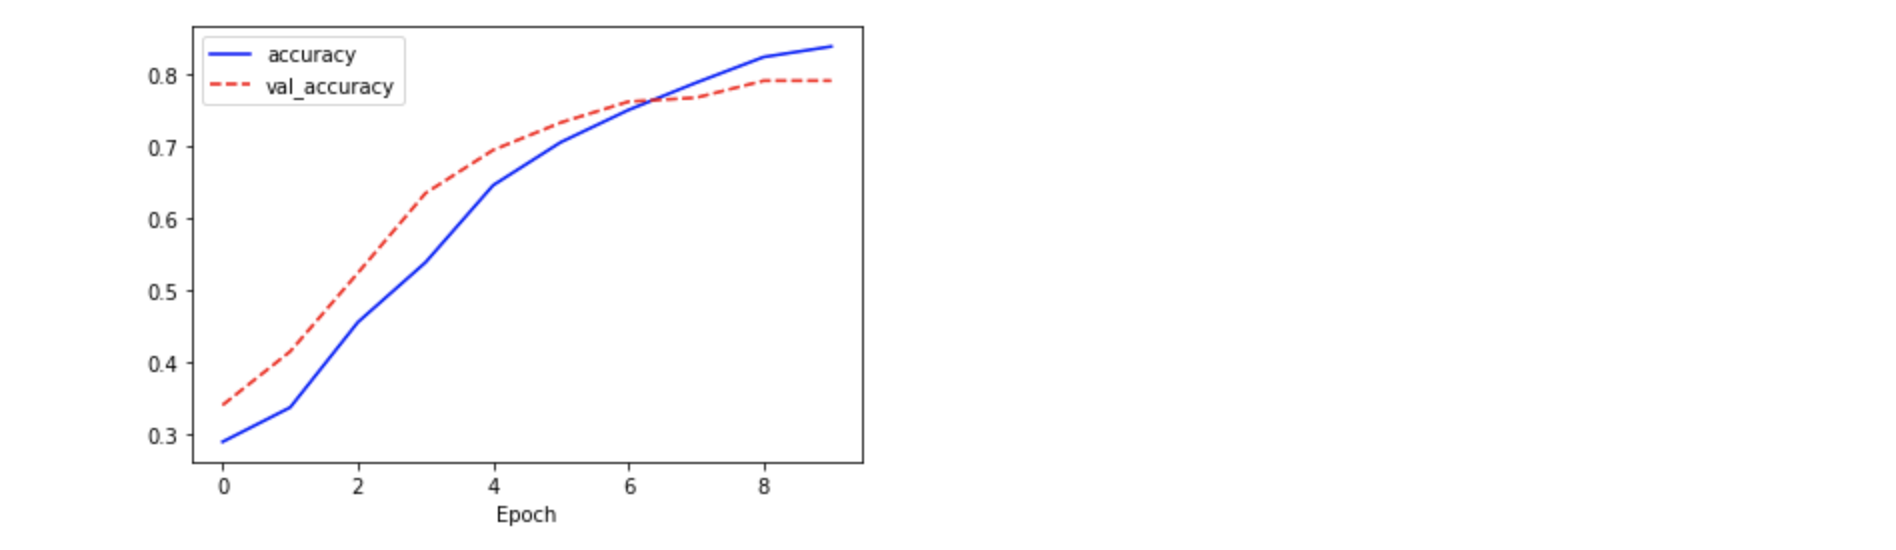
## Plot accuracy
plt.plot(history.history['accuracy'], 'b-', label='accuracy')
plt.plot(history.history['val_accuracy'], 'r--', label='val_accuracy')
plt.xlabel('Epoch')
plt.legend()
plt.show()
## 결과 확인
def plot_image(i, predictions_array, true_label, img):
    predictions_array, true_label, img = predictions_array[i], true_label[i], img[i]
    plt.grid(False)
    plt.xticks([])
    plt.yticks([])

    plt.imshow(img)

    predicted_label = np.argmax(predictions_array)
    if predicted_label == true_label:
        color = 'blue'
    else:
        color = 'red'

    plt.xlabel("{} {:2.0f}% ({})".format(class_name[predicted_label],
                                100*np.max(predictions_array),
                                class_name[true_label]),
                                color=color)

def plot_value_array(i, predictions_array, true_label):
    predictions_array, true_label = predictions_array[i], true_label[i]
    plt.grid(False)
    #plt.xticks([])
    plt.xticks(range(N_CLASS), class_name, rotation=90)
    plt.yticks([])
    thisplot = plt.bar(range(N_CLASS), predictions_array, color="#777777")
    plt.ylim([0, 1])
    predicted_label = np.argmax(predictions_array)

    thisplot[predicted_label].set_color('red')
    thisplot[true_label].set_color('blue')
rnd_idx = np.random.randint(1, N_TEST//N_BATCH)
img_cnt = 0
for images, labels in test_dataset:
img_cnt += 1
if img_cnt != rnd_idx:
continue
predictions = model(images, training=False)
num_rows = 5
num_cols = 3
num_images = num_rows*num_cols
labels = tf.argmax(labels, axis=-1)
plt.figure(figsize=(3*2*num_cols, 4*num_rows))
plt.subplots_adjust(hspace=1.0)
for i in range(num_images):
plt.subplot(num_rows, 2*num_cols, 2*i+1)
plot_image(i, predictions.numpy(), labels.numpy(), images.numpy())
plt.subplot(num_rows, 2*num_cols, 2*i+2)
plot_value_array(i, predictions.numpy(), labels.numpy())
break